目录
引言
最近做项目时,发现生产机器出现过内存泄露,研究发现是kafka任务执行时不释放内存引起。 这让我想重拾一下之前对python代码的性能监控。本文只从性能监控说起,不讨论代码的优化
分析一个程序的性能可以归结为回答4个基本的问题:
1.它运行的有多块?
2.那里是速度的瓶颈?
3.它使用了多少内存?
4.哪里发生了内存泄漏?
下面,我们将用一些很酷的工具,深入细节的回答这些问题。
使用Timeit
Python 提供了timeit模块,用来测试代码块的运行时间。它既提供了命令行接口,又能用于代码文件之中
命令行接口
$ python -m timeit -n 1000000 '"I like to reading.".replace(" ", "-")'
1000000 loops, best of 3: 0.253 usec per loop
$ python -m timeit -s 'orignal_str = "I like to reading."' '"-".join(orignal_str.split())'
1000000 loops, best of 3: 0.53 usec per loop
具体参数使用可以用命令 python -m timeit -h 查看帮助。使用较多的是下面的选项:
-s S, –setup=S: 用来初始化statement中的变量,只运行一次;
-n N, –number=N: 执行statement的次数,默认会选择一个合适的数字;
-r N, –repeat=N: 重复测试的次数,默认为3;
Python 接口
可以用下面的程序测试:
def find():
    list = ['a', 'b', 'is', 'python', 'jason', 'hello', 'hill', 'with', 'phone', 'test',
            'dfdf', 'apple', 'pddf', 'ind', 'basic', 'none', 'baecr', 'var', 'bana', 'dd', 'wrd']
    # list = dict.fromkeys(list,True)
    print list
    filter = []
    for i in range(1000000):
        for find in ['is', 'hat', 'new', 'list', 'old', '.']:
            if find not in list:
                filter.append(find)
import timeit
timeit.timeit(stmt=find, number=5)
profile
profile 或者cProfile,它可以统计程序里每一个函数的运行时间,并且提供了可视化的报表。大多情况下,建议使用cProfile,它是profile的C实现,适用于运行时间长的程序。不过有的系统可能不支持cProfile,此时只好用profile。 很多时候我们感兴趣的可能只有耗时最多的几个函数,这个时候先将cProfile 的输出保存到诊断文件中,然后用 pstats 定制更加有好的输出
def P():

    def a(shortStrs):
        return [str(s) for s in shortStrs]
    shortStrs = range(100000)
    for i in range(3):
        [str(s) for s in shortStrs]
    for i in range(3):
        shortStrs = a(shortStrs)
    ss = ''.join(shortStrs)
    print ss
 import cProfile
 import pstats
 from test import P
 cProfile.run('P()')
 p = pstats.Stats('timeit')
 p.sort_stats('time')
 p.print_stats(6)
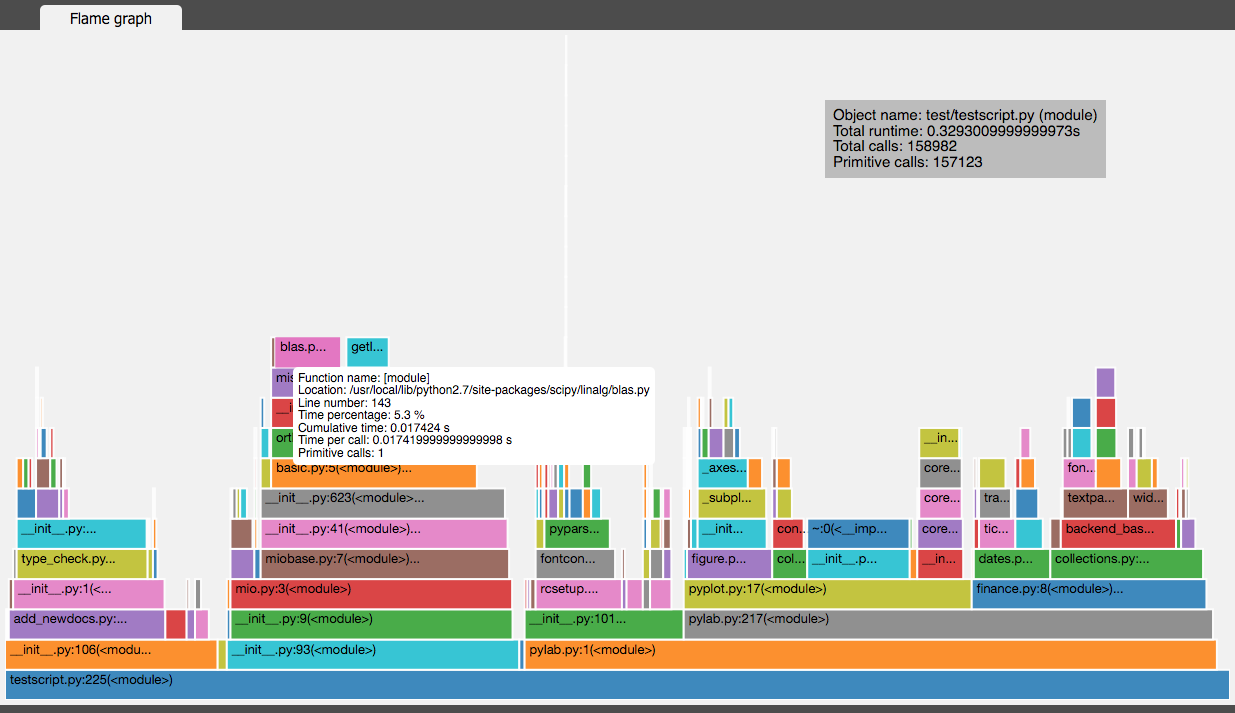
vprof
vprof 也是一个不错的可视化工具,可以用来分析 Python 程序运行时间情况。如下图:
line_profiler
上面的测试最多统计到函数的执行时间,很多时候我们想知道函数里面每一行代码的执行效率,这时候就可以用到 line_profiler 了。
$ pip install line_profiler
一旦安装完成,你将会使用一个称做“line_profiler”的新模组和一个“kernprof.py”可执行脚本。 line_profiler 的使用特别简单,在需要监控的函数前面加上 @profile 装饰器。然后用它提供的 一旦你已经设置好了@profile装饰器,使用kernprof.py执行你的脚本。 首先执行 python primes.py
Filename: primes.py
@profile
def primes(n):
    if n==2:
        return [2]
    elif n<2:
        return []
    s=range(3,n+1,2)
    mroot = n ** 0.5
    half=(n+1)/2-1
    i=0
    m=3
    while m <= mroot:
        if s[i]:
            j=(m*m-3)/2
            s[j]=0
            while j<half:
                s[j]=0
                j+=m
        i=i+1
        m=2*i+3
    return [2]+[x for x in s if x]
primes(200)
然后执行
$ kernprof.py -l -v fib.py
-l选项通知kernprof注入@profile装饰器到你的脚步的内建函数,-v选项通知kernprof在脚本执行完毕的时候显示计时信息。上述脚本的输出看起来像这样: 运行之后 会得到如下结果,寻找具有高Hits值或高Time值的行。这些就是可以通过优化带来最大改善的地方。:
Wrote profile results to primes.py.lprof
Timer unit: 1e-06 s

File: primes.py
Function: primes at line 2
Total time: 0.00019 s

Line #      Hits         Time  Per Hit   % Time  Line Contents
==============================================================
     2                                           @profile
     3                                           def primes(n):
     4         1            2      2.0      1.1      if n==2:
     5                                                   return [2]
     6         1            1      1.0      0.5      elif n<2:
     7                                                   return []
     8         1            4      4.0      2.1      s=range(3,n+1,2)
     9         1           10     10.0      5.3      mroot = n ** 0.5
    10         1            2      2.0      1.1      half=(n+1)/2-1
    11         1            1      1.0      0.5      i=0
    12         1            1      1.0      0.5      m=3
    13         5            7      1.4      3.7      while m <= mroot:
    14         4            4      1.0      2.1          if s[i]:
    15         3            4      1.3      2.1              j=(m*m-3)/2
    16         3            4      1.3      2.1              s[j]=0
    17        31           31      1.0     16.3              while j<half:
    18        28           28      1.0     14.7                  s[j]=0
    19        28           29      1.0     15.3                  j+=m
    20         4            4      1.0      2.1          i=i+1
    21         4            4      1.0      2.1          m=2*i+3
    22        50           54      1.1     28.4      return [2]+[x for x in s if x]
输出每列的含义如下:
Line #: 行号
Hits: 当前行执行的次数.
Time: 当前行执行耗费的时间,单位为 “Timer unit:”
Per Hit: 平均执行一次耗费的时间.
% Time: 当前行执行时间占总时间的比例.
Line Contents: 当前行的代码
line_profiler 执行时间的估计不是特别精确,不过可以用来分析当前函数中哪些行是瓶颈。
memory_profiler
memory_profiler是一个不错的内存分析器, 通过对每行代码对检查, 可以查处代码的瓶颈在哪, 能看到代码快的内存占比
$ pip install -U memory_profiler
$ pip install psutil
就像line_profiler,memory_profiler也需要在感兴趣的函数上面装饰@profile装饰器
@profile
def primes(n):
    ...
    ...
$ python -m memory_profiler primes.py
一旦程序退出,你将会看到看起来像这样的输出: ```python Filename: primes.py
Line # Mem usage Increment Line Contents
 2                           @profile
 3    7.9219 MB  0.0000 MB   def primes(n):
 4    7.9219 MB  0.0000 MB       if n==2:
 5                                   return [2]
 6    7.9219 MB  0.0000 MB       elif n<2:
 7                                   return []
 8    7.9219 MB  0.0000 MB       s=range(3,n+1,2)
 9    7.9258 MB  0.0039 MB       mroot = n ** 0.5
10    7.9258 MB  0.0000 MB       half=(n+1)/2-1
11    7.9258 MB  0.0000 MB       i=0
12    7.9258 MB  0.0000 MB       m=3
13    7.9297 MB  0.0039 MB       while m <= mroot:
14    7.9297 MB  0.0000 MB           if s[i]:
15    7.9297 MB  0.0000 MB               j=(m*m-3)/2
16    7.9258 MB -0.0039 MB               s[j]=0
17    7.9297 MB  0.0039 MB               while j<half:
18    7.9297 MB  0.0000 MB                   s[j]=0
19    7.9297 MB  0.0000 MB                   j+=m
20    7.9297 MB  0.0000 MB           i=i+1
21    7.9297 MB  0.0000 MB           m=2*i+3
22    7.9297 MB  0.0000 MB       return [2]+[x for x in s if x] ``